Metso Insights Blog Mining and metals blog Detailed opex comparison of modern copper smelting technologies using hsc-sim
Metals refining
Nov 15, 2019

Detailed OPEX comparison of modern copper smelting technologies using HSC-SIM

It is well known that there are many ways to process copper concentrates into copper anodes using the pyrometallurgical route. All modern copper smelting technologies are fundamentally energy efficient and environmentally safe options, so choosing the right one depends on the desired capacity range, feed impurity levels, plant location, flexibility needs, overall energy use, and of course smelter economics in both the short and long term.
Flowsheet example comparing a flash smelting furnace and a flash converter
Figure 1. Flowsheet example comparing a flash smelting furnace and a flash converter

Since there are major differences between the technologies, we decided to model each process flowsheet using the Outotec HSC-SIM process modeling tool to see how they would perform against each other in terms of OPEX when simulated in the same way. The configurations we chose to include in the comparison were:

  1. Outotec Flash Smelting (FSF) – Outotec-Kennecott Flash Converting (FCF)
  2. Outotec Flash Smelting (FSF) – Peirce-Smith Converting (PSC)
  3. Outotec Ausmelt TSL Smelting (ASF) – Peirce-Smith Converting (PSC)
  4. Outotec Ausmelt TSL Smelting (ASF) – Outotec Ausmelt TSL Converting (ACF)
  5. Mitsubishi Smelting Process (MIT)
  6. Bottom Blowing Reactor (BBR) – Bottom Blowing Continuous Converting (BCC)
  7. Side Blowing Furnace (SBF) – Top Blowing Converting (TBC)

Methodology and base parameters

All seven smelting routes were tasked to produce blister copper from clean copper concentrate, with an annual treatment capacity of 1.2 million tonnes. Fire refining of the blister copper to anodes was not included due to the relatively similar blister quality between processes when impurities are missing. In addition, evaluation was limited to the ID fan outlets of the smelter off-gases, meaning no wet gas cleaning and acid plant subprocesses either.

For simplicity, the number of concentrate components was limited and impurity elements were excluded. The concentrate grade used together with its analysis is presented in Table 1. The term “Others” in the table and calculations describes the proportion of additional impurity elements in the concentrate with no effect on the main component concentrations. The initial moisture of the concentrate was set to a typical 8%.
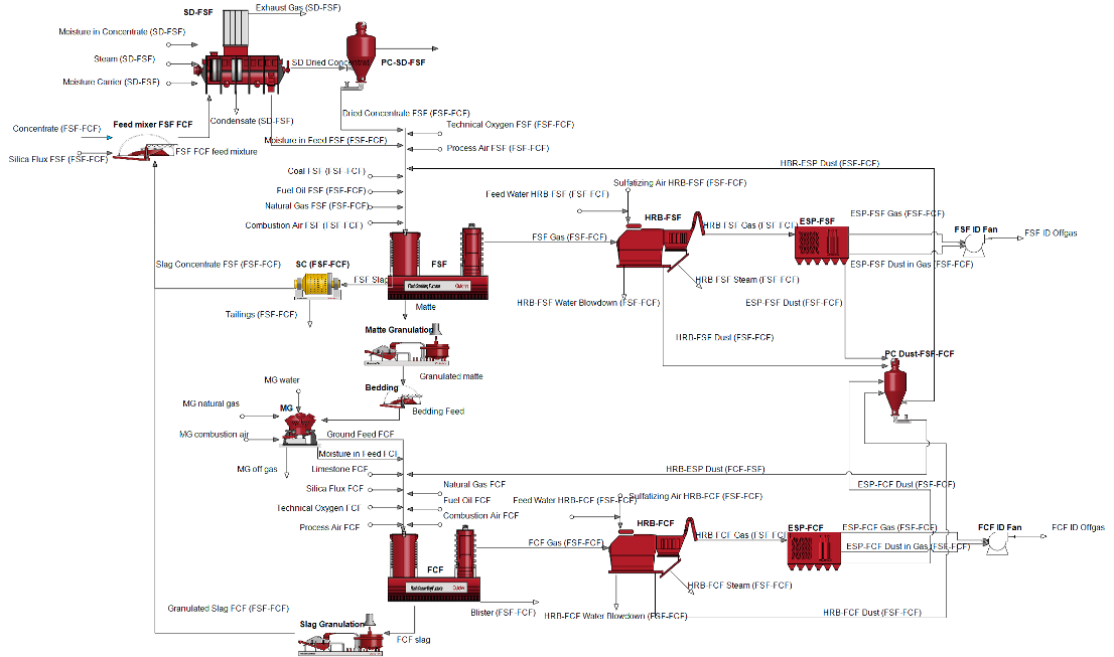
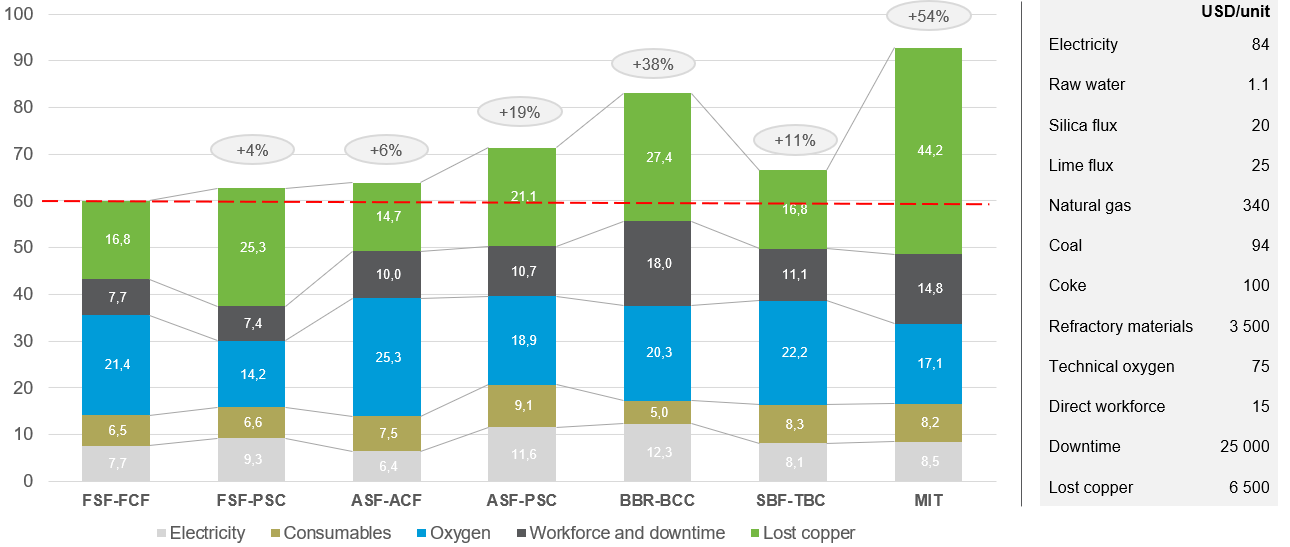
Table 1. Copper concentrate composition

CuFeSSiO2CaOMgOAl2O3Others
27263181133

All furnace units were dimensioned to obtain to appropriate refractory amounts, annual availability hours, heat loss values, and electricity consumption for the given process. The refractory mass was basically a function of residence time versus the required melt and gas volume flow multiplied by the brick thickness on each surface. Annual operation times were full campaign years with major and minor shutdowns and standby situations deducted. Heat losses were estimated based on surface area and whether they were water or air cooled. Electricity consumption calculations relied on the earlier published work of one of the authors.

Generally, all results were cross-checked against real-life references and literature. Where data was reliable, the authors used the information as such. Where there was a conflict, for example when a parameter applied to a process model produced an impossible outcome (like with the BBR slag flotation), a deviation to the reported data point was made with considerable care.

Results and discussion

The results of the HSC-SIM simulations are shown in Table 2 and the same information has been translated into US dollar values in Figure 2. Overall, the results clearly indicate that the total operational cost appears to be strongly dependent on the copper smelting technology used in the smelting process. In this study, the FSF-FCF, FSF-PSC, ASF-ACF, and SBF-TBC processes achieved the lowest costs with the applied parameters and unit costs. This is mostly explained by their being balanced processes without any apparent downsides such as excessive electricity use or poor copper recovery.

Naturally this study only reflects a snapshot of the true picture; more work is required to simulate the processes with full smelter scope, a CAPEX element, and sensibility analysis included.


by Ali Bunjaku, Hannu Johto, Lauri Pesonen

This article is a shortened version of the Copper 2019 conference paper published in August 2019. For more detailed information about the results or methodology, please see the article or contact the authors.

Table 2. Throughput consumptions of different flowsheets simulated and calculated by HSC-SIM for an annual feed of 1.2 Mt concentrate with 27% Cu

Units

FSF-FCF

FSF-PSC

ASF-ACF

ASF-PSC

BBR-BCC

SBF-TBC

MIT

Annual operation time

h/a

8 130

8 145

7 878

7 854

7 557

7 709

7 683

Annual standby time

h/a

432

432

576

576

576

720

576

Electricity

MWh/a

91 177

110 492

76 245

138 190

146 268

96 760

100 622

Raw water

m3/a

938 686

864 194

919 066

890 673

758 318

830 770

269 554

Silica flux

t/a

109 375

158 539

106 676

189 015

98 791

156 109

181 880

Lime flux

t/a

42 176

0

55 592

37 629

0

4 953

86 013

Natural gas

kNm3/a

3 915

152

118

121

99

472

1 224

Coal

t/a

0

0

20 733

7 715

2 597

26 726

0

Coke

t/a

0

1 457

0

1 457

3 713

0

0

Refractory materials

t/a

268

641

287

711

447

406

485

Technical oxygen

kNm3/a

284 944

189 562

337 230

252 229

271 017

296 381

227 668

Direct workforce

h/a

180 943

189 703

154 663

163 423

154 663

189 703

154 663

Blister Cu production

t/a

321 281

320 024

321 770

320 823

319 743

321 413

317 213

Downtime

h/a

198

183

306

330

627

331

501

Cu recovery

%

99.2

98.8

99.3

99.0

98.7

99.2

97.9

Calculated operating expenses in MUSD, 1.2 Mtpa, 27% Cu
Figure 2. Calculated operating expenses in MUSD, 1.2 Mtpa, 27% Cu
Metals refining