FIXED PRIMARY SAMPLES WITH SECONDARY SAMPLER
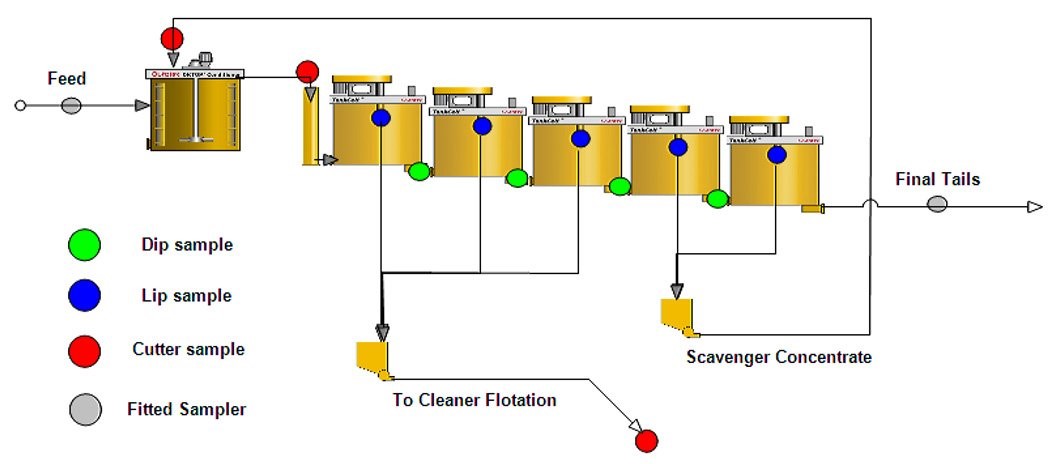
Fixed samplers, such as Outotec Metallurgical Sampler Assembly (MSA), Launder Sampler Assembly (LSA) and Pressurized Sampler Assembly (PSA), are designed to collect representative samples from the process. When the collected samples are further divided with a secondary sampler, such as Courier® Multiplexer or Linear Moving Cutter (LMC) sampler, the sample is collected from the process as representatively as possible. Therefore, fixed samplers should be used in a sampling campaign whenever possible.
SAMPLING METHODOLOGY
Sampling is a form of art with a heavily theoretical background (Gy, P. 1979; Johnson, B. 2010; and Napier-Munn, T. 2010). In order to collect representative samples, a very large sample size and many individual samples are often required. This is often too time-consuming and unpractical for process audits where the sampling campaign should be completed relatively quickly and with minimal changes to the process. Therefore, more practical methods developed from the theory are often used.
Below are a few practical guidelines on how to carry out sampling campaigns:
- At least four sampling rounds
- Individual samples collected from each round
- Each individual sample (collected each round) should have as many cuts as practically possible – the recommendation is a minimum of 20 cuts with cutters and 3 with lip and dip samplers
- Take three repeatability samples from the same stream with the same sampling equipment to determine the sampling error of each device
- The same person should take the same samples each round to minimize the effect of human error on the results between sampling rounds
- Record the commencement and end of the sampling campaign
LABORATORY FLOTATION TESTING
“Hot laboratory flotation” tests are a common method to assess the floatability of the slurry collected from an operating flotation circuit. The objective of hot flotation tests is to transfer process slurry properties to a laboratory scale flotation cell by collecting a test feed sample directly from a process stream.
The main outcomes of hot flotation tests are the recoveries, grades and kinetics of the main minerals from a certain flotation stage. On the basis of the kinetics of the main minerals at different flotation stages, it is possible to simulate the feed mineralogy, flowsheet, flotation cell sizes and feed flowrates at each stage of the continuously operating industrial-scale circuit. The built simulator can be used as a tool to indicate how the performance of the process can be enhanced through modernization. Remes (2016b) described how a simulator can be built from test data in Minerva Issue 3/2016, and Mattsson et al. (2015) presented how simulators can be used to evaluate the benefits of plant modernization.
PLANT PERFORMANCE VS LABORATORY PERFORMANCE
The mass balance calculation gives the basis to assess the performance of the surveyed circuit. The laboratory test gives the recovery limits for the ore processed during the survey when the samples for the laboratory test are collected during the sampling campaign. By comparing these results, it is possible to evaluate whether the process is operating at full performance. The evaluation is carried out by means of process simulations. A more detailed approach on the simulation as a tool for flotation plant surveys was presented by Mattsson et al. (2015). The flotation plant simulator’s built up was briefly presented by Remes (2016-2). For mass balance calculation, floatation kinetics fitting and flotation process simulation, the Outotec HSC Chemistry® software package is used.
OUTCOMES OF PROCESS SURVEY
The process survey data is handled to form: 1) mass balance of the circuit, 2) flotation kinetic models of the laboratory tests and 3) process simulation model. The mass balance is the basis for performance assessment. also It is also used to obtain the volumetric flow rates and flotation cell residence times, and it may be accompanied by gas dispersion measurement results. The flotation kinetics tests are compared to the plant results to obtain the scale-up factor for the process. The simulation model is used for evaluating the benefits of best-performing, modernized plants and possible alternative processing configurations.
Both the mass balance and the simulation model are applied for bottleneck identification. The following are examples of typical flotation circuit performance bottlenecks:
- Recirculation loads from the cleaner: The low performance flotation stages are to be identified.
- Enrichment ratios not in the recommended ranges: These stages or individual cells are discovered.
- Residence times: Are they sufficient to achieve the target recoveries with the current plant capacity and feed composition? Is there indication of cell short-circuiting?
- Is the rougher distribution box delivering material evenly (flow rates and compositions)? An uneven rougher line by line operation can result in significant recovery losses.
- Mass pull of the cells: Are they operating consistently in the down-the-bank profile?
- Lip loads of the cells: They should not exceed the predefined limits.
- Froth carry rates (t/h/m2): They should be within the recommended stage-specific ranges. If they are too high or too low, the rates will reduce the froth recovery. It must be at the optimal operating point.
- Plant performance differs abnormally from the laboratory flotation: Scale-up factors and froth recovery characteristics are estimated and compared to the best predicted performance.
- Poor recovery of fine or coarse fractions: The survey can be carried out by mineral basis to reveal particle size-based performance problems
- Flotation selectivity: If problems are detected, a comparison to laboratory results and a review of process operating conditions are necessary.
- Mineral liberation-based grade-recovery problems: Separate mineralogical samples are collected and sent for mineral liberation analysis (MLA). This will give an in-depth particle composition study, addressing the needs for grinding and regrinding optimization during flotation.
- To deepen the flotation assessment, cell froth recovery measurements, gas dispersion measurements (pulp phase bubble size distributions and superficial gas velocities) and/or reagent dosage analyses can also be included.
In addition to process sampling, the metallurgical assessment includes visual inspection of cell operation, especially froth stability and transportation characteristics. Furthermore, the process audit can be extended to include both process automation assessment and equipment mechanical assessment. Also, process audits can be expanded to cover assessments of grinding and/or dewatering sections.
SUMMARY
Process audits consist of process stream sampling, sample treatment, chemical analysis, data reconciliation and mass balancing. Based on the established solids and water balances, it is possible to evaluate the performance of the process and to identify its bottlenecks.
When the established mass balance is compared to the measured flotation performance on the laboratory scale, it is possible to evaluate what the maximal recovery could be. The residence times on the plant and laboratory scale give valuable information on the required flotation volumes. Similarly, by comparing the results, it is possible to detect recovery issues related to the froth area or froth transportation.
REFERENCES
Gy, P. 1979. Sampling of particulate minerals – theory and practice. Developments in Geomathematics 4. Elseview Scientific Publishing Company.
Johnson, B. 2010. Flotation Plant Optimisation. A Metallurgical Guide to Identifying and Solving Problems in Flotation Plants. Chapter 2: “Existing Methods for Process Analysis”. Ed: Greet, C. The Australasian Institute of Mining and Metallurgy. Spectrum Series 16. < br /> Napier-Munn, T., 2010.Flotation Plant Optimisation. A Metallurgical Guide to Identifying and Solving Problems in Flotation Plants. Chapter 10: “Designing and Analysing Plant Trials”. Ed: Greet, C. The Australasian Institute of Mining and Metallurgy. Spectrum Series 16.
Mattsson, T., Remes A., and Tirkkonen M. 2015. Flotation Circuit Simulation as a Tool to Evaluate Benefits of Flotation Cell Modernization. SME conference.
Remes, A. 2016a. Minerva 2016-2. Mass Balancing of Concentrator Data.
Remes, A. 2016b. Minerva 2016-3.
Utilizing Plant Simulation to Design and Optimize Flotation Process. Outotec HSC Chemistry

